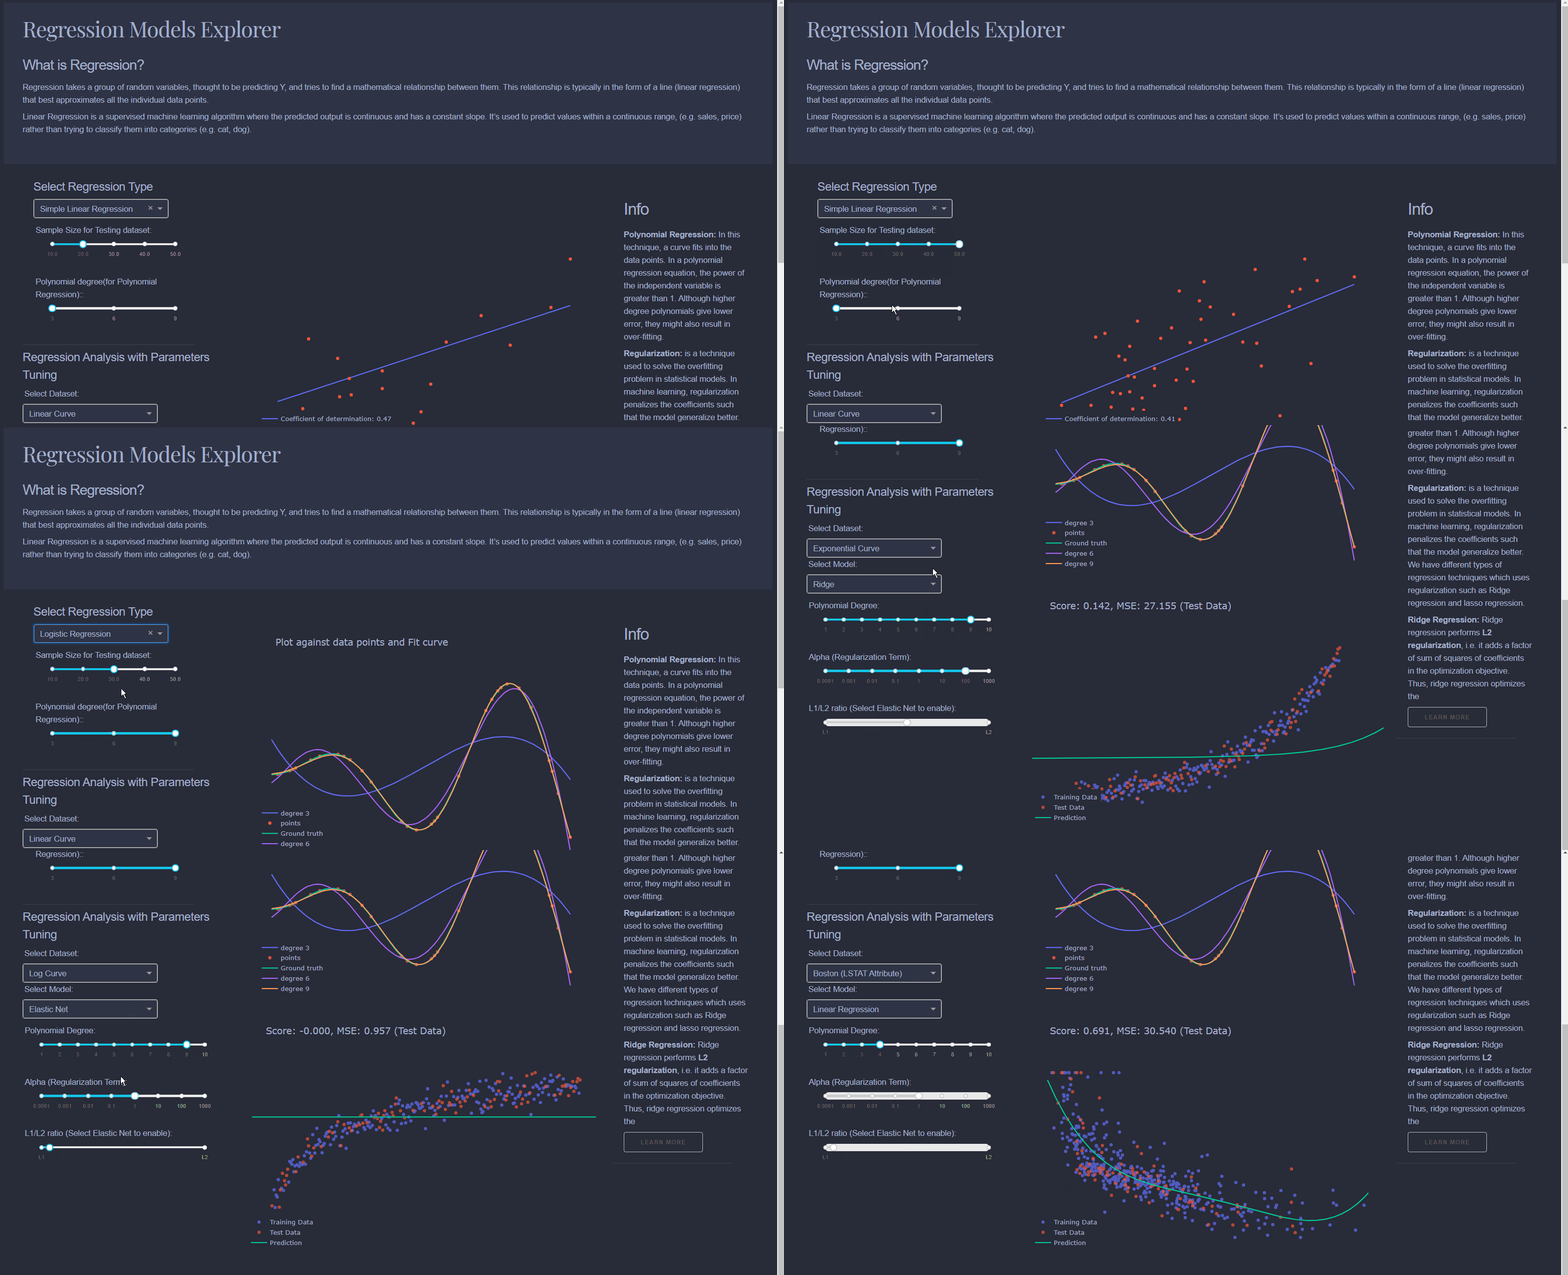

Linear Regression: Draws a line that best fits data scattered on a graph. Produces continuous variables.Logistic Regression: Predicts a binary outcome based on a series of independent variables. For example, if you're trying to predict whether someone has heart disease or not based on their health parameters.
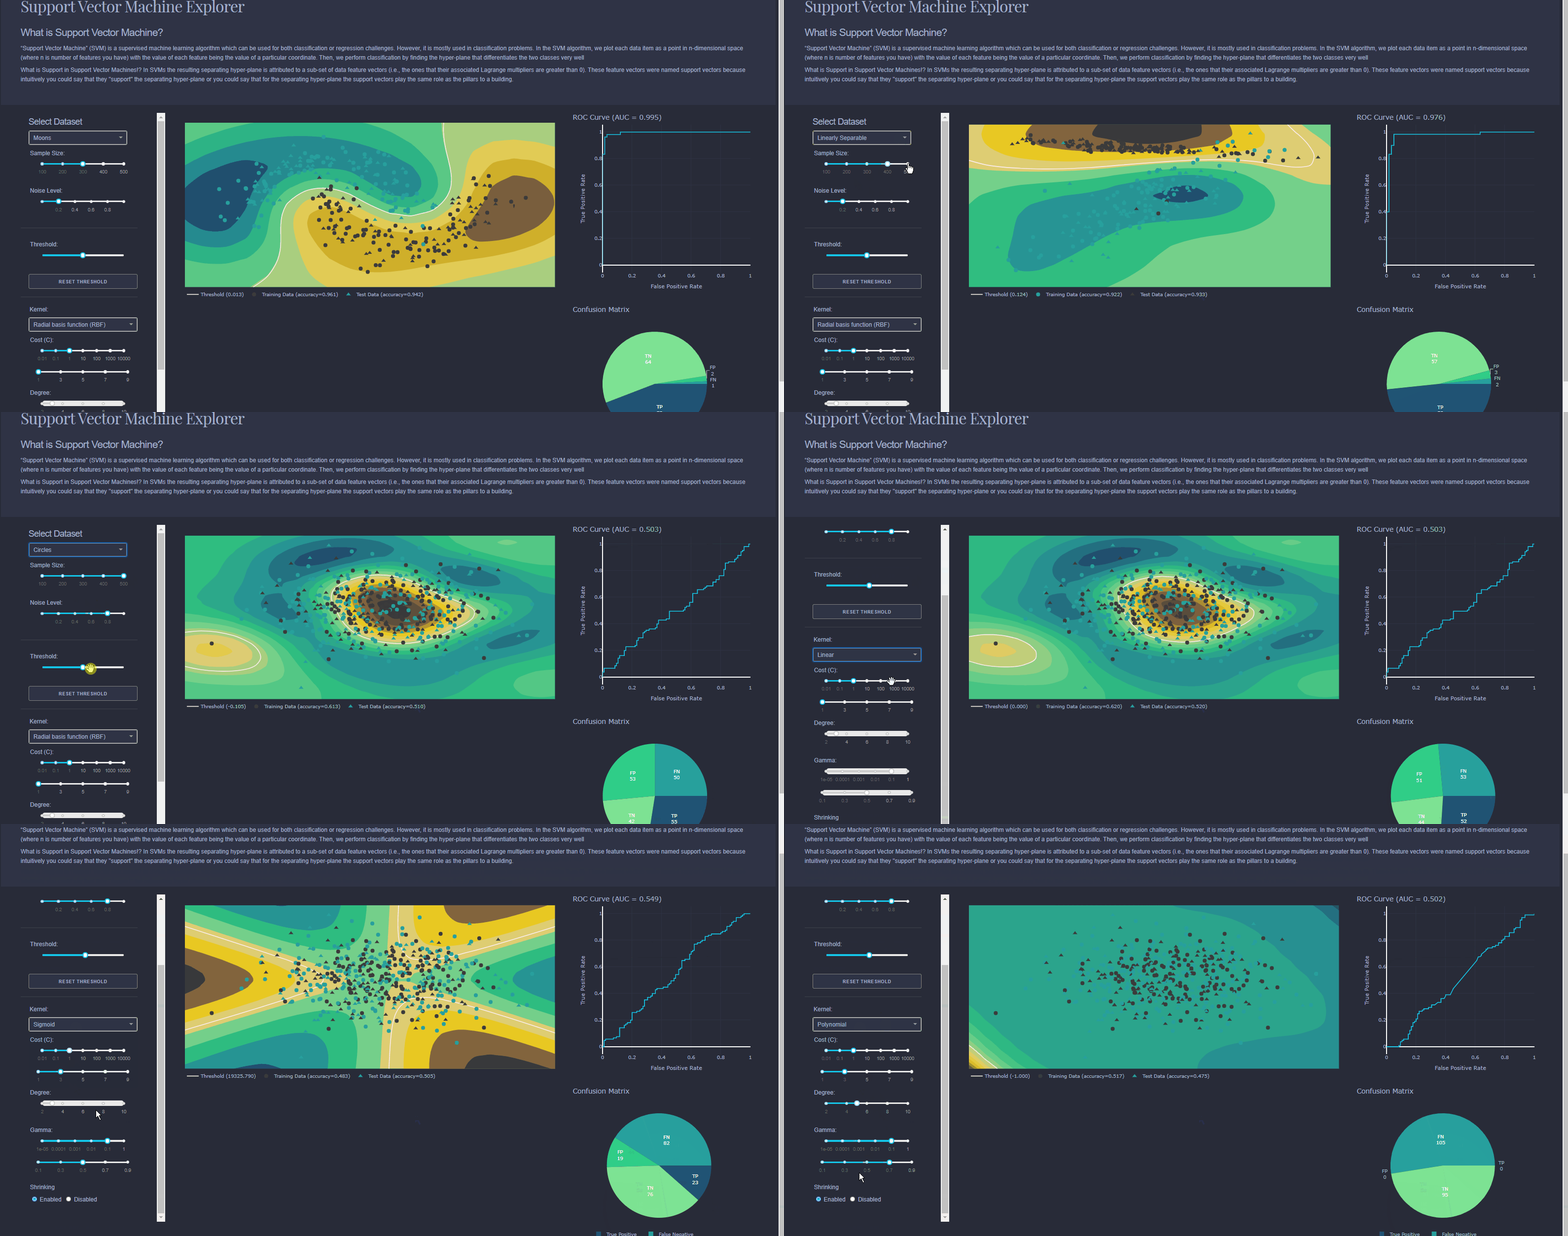

Can be used for classification or regression. Try to find best way to seperate data points using multiple planes (referred to as Hyperplanes). Imagine a road running through a city with red cars on the left and green cars on the right, the SVM is the road. With more data, you might need more dimensions.
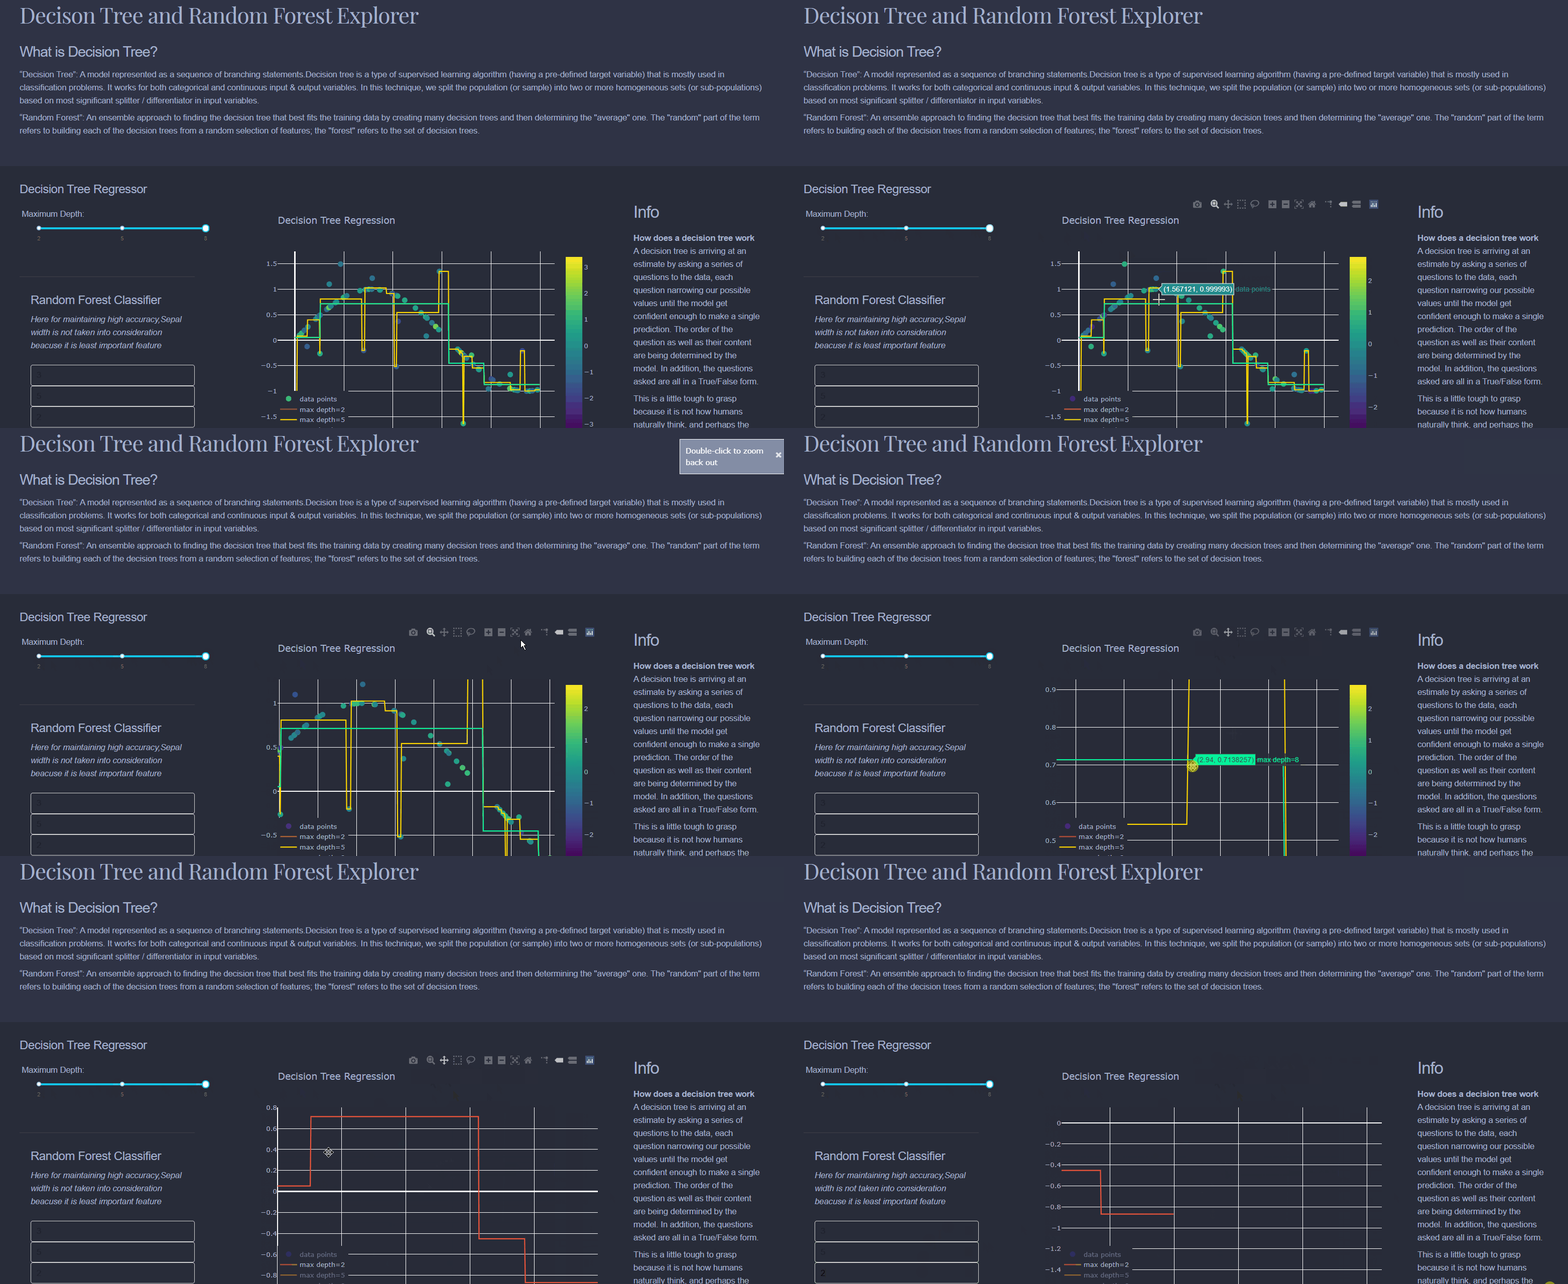

Can be used for classification and regression (very valuable algorithm for structured data). Decision trees split data based on criteria such as, "is over 50" and "has average heart rate lower than 65" eventually getting to a point where the data can't be split anymore (you can define this). Random Forests are a combination of many decision trees, effectively leveraging and combining the choices of many models (this technique of using a combination of models is known as ensembling).
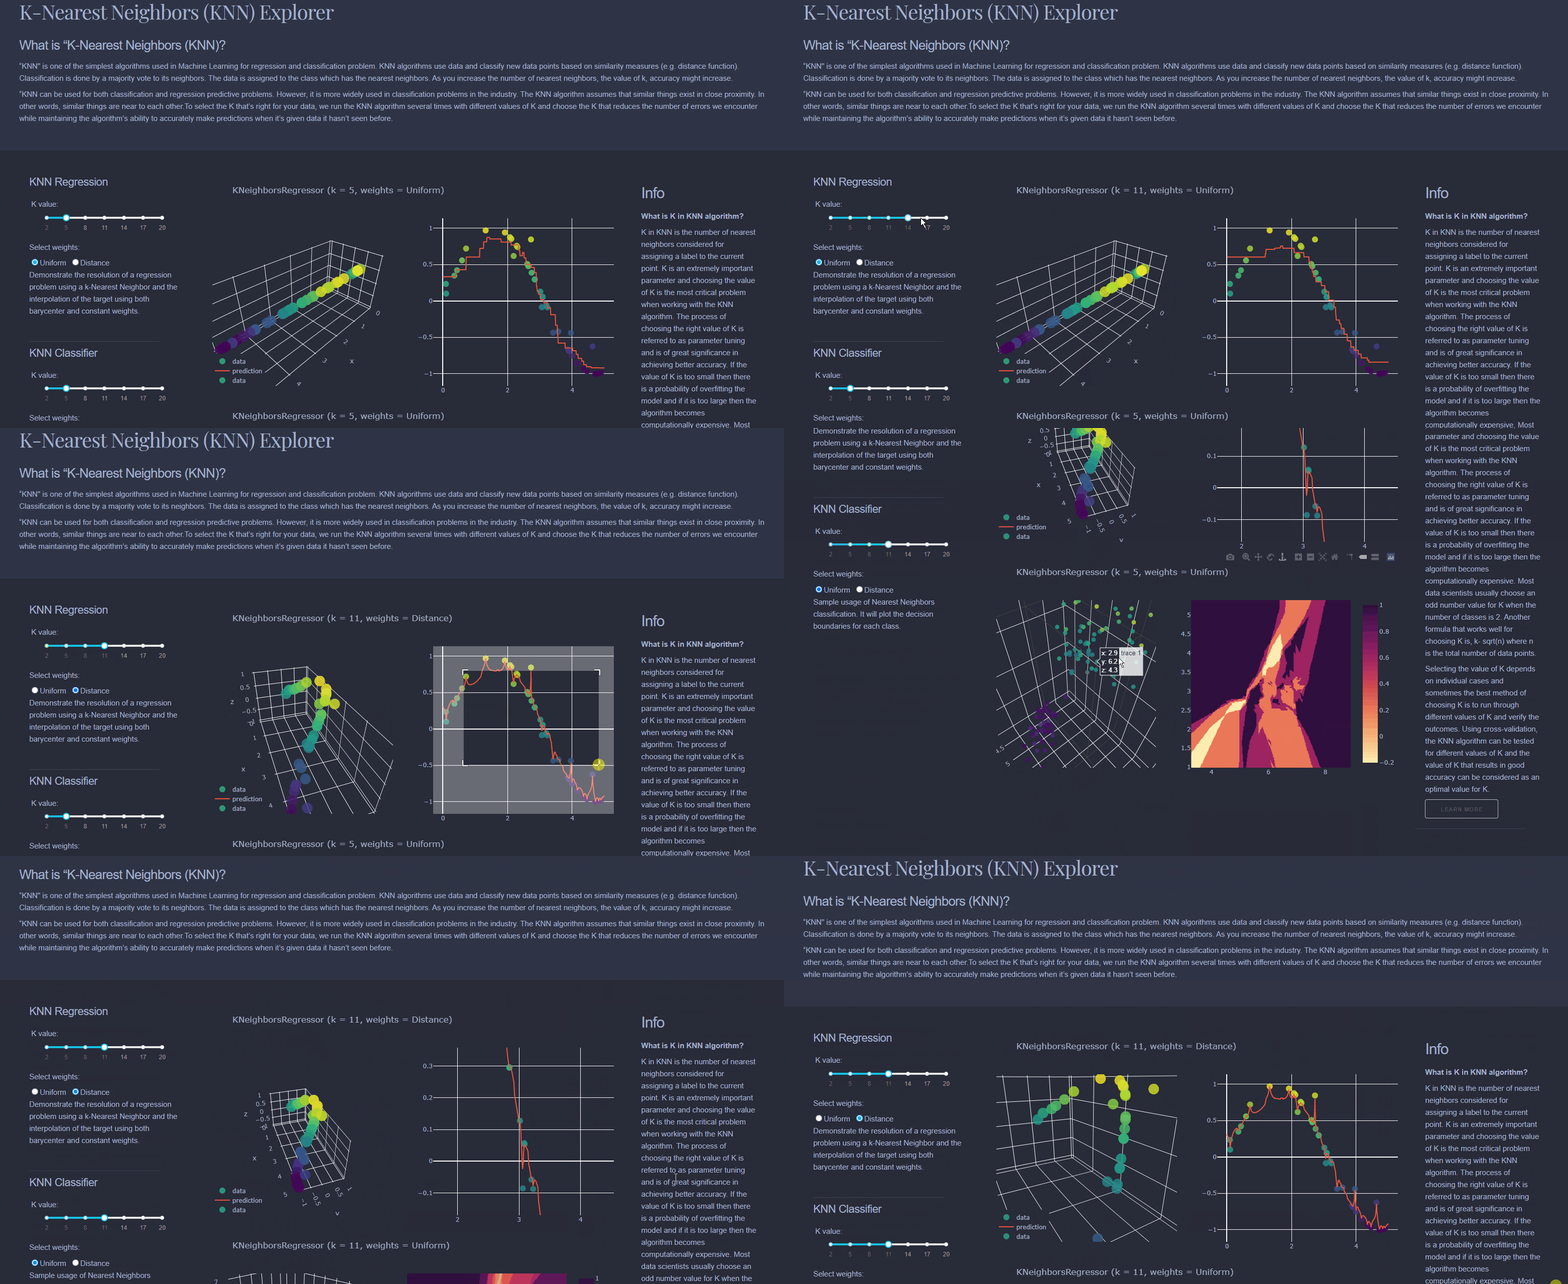
Find the 'k' examples which are most similar to each other. Then, given a new sample, which is the new sample most closely aligned with?
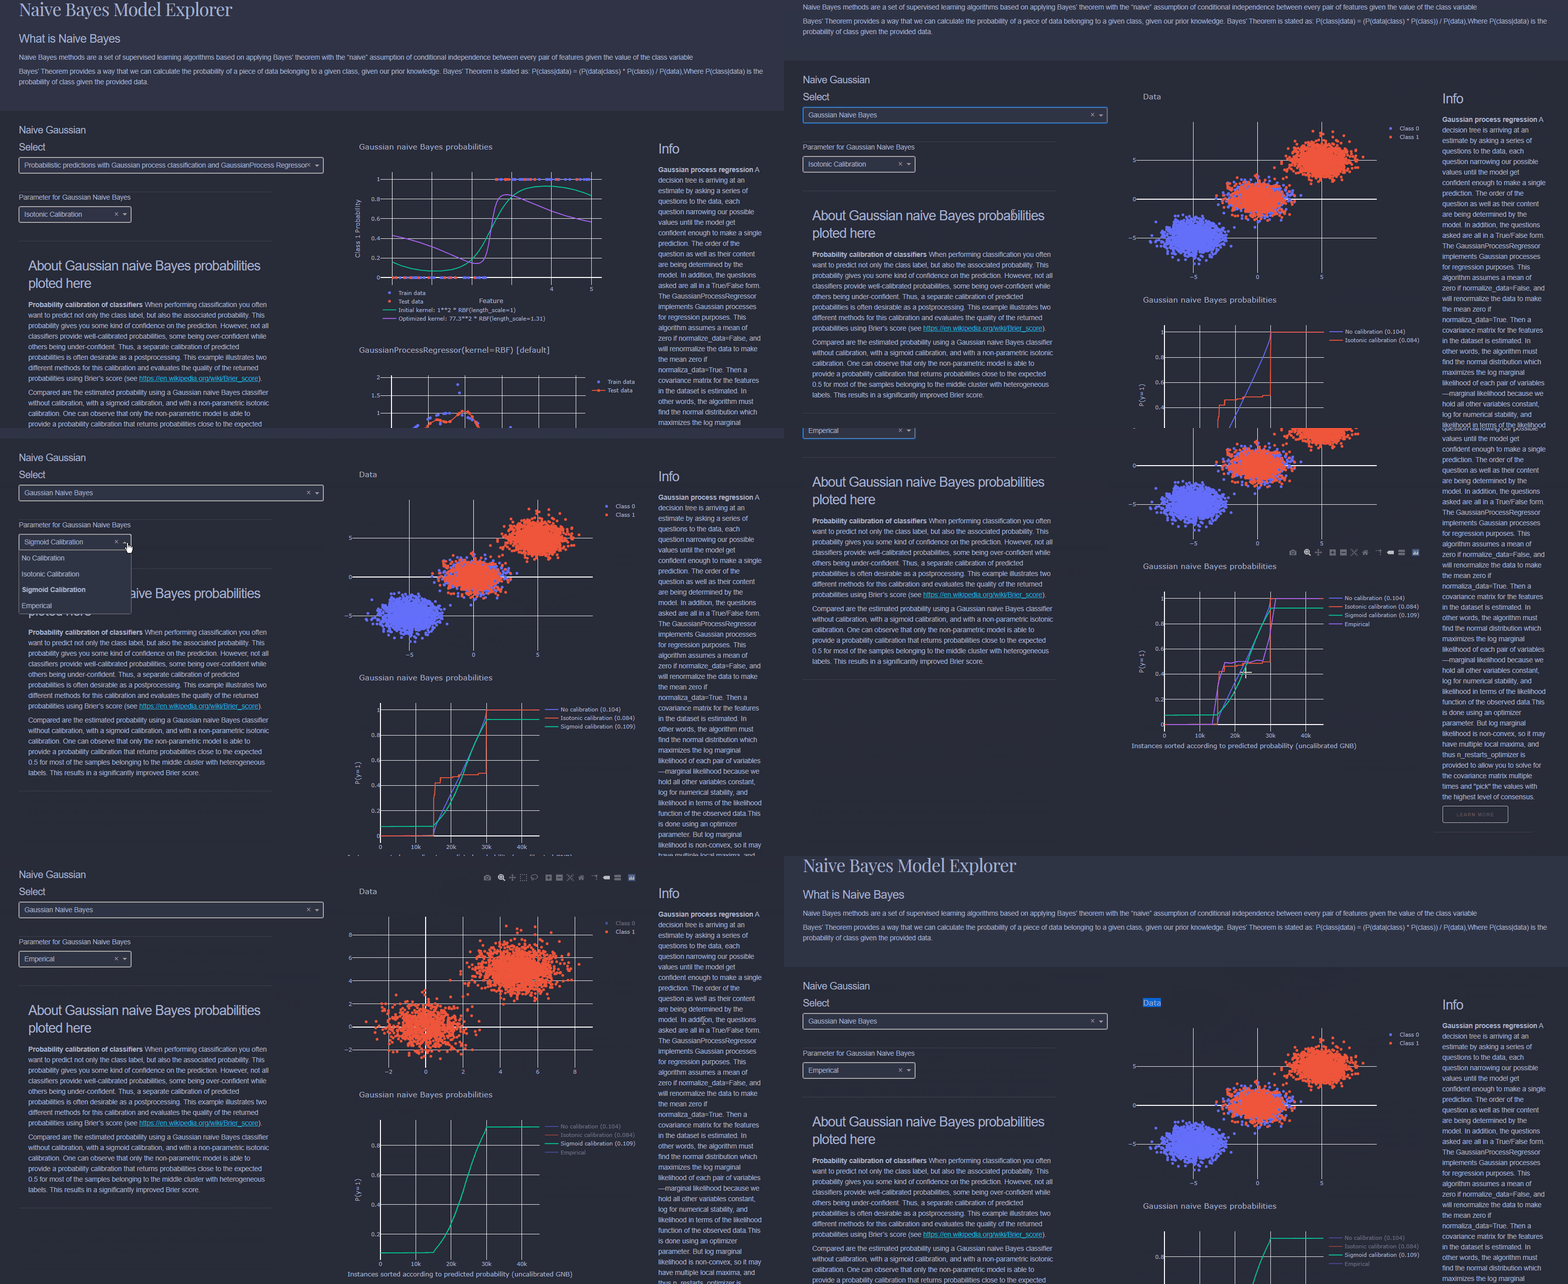
Naive Bayes is a collection of classification algorithms based on Bayes Theorem. It is not a single algorithm but a family of algorithms that all share a common principle, that every feature being classified is independent of the value of any other feature. So for example, a fruit may be considered to be an apple if it is red, round, and about 3" in diameter. A Naive Bayes classifier considers each of these “features” (red, round, 3” in diameter) to contribute independently to the probability that the fruit is an apple, regardless of any correlations between features. Features, however, aren’t always independent which is often seen as a shortcoming of the Naive Bayes algorithm and this is why it’s labeled “naive”.
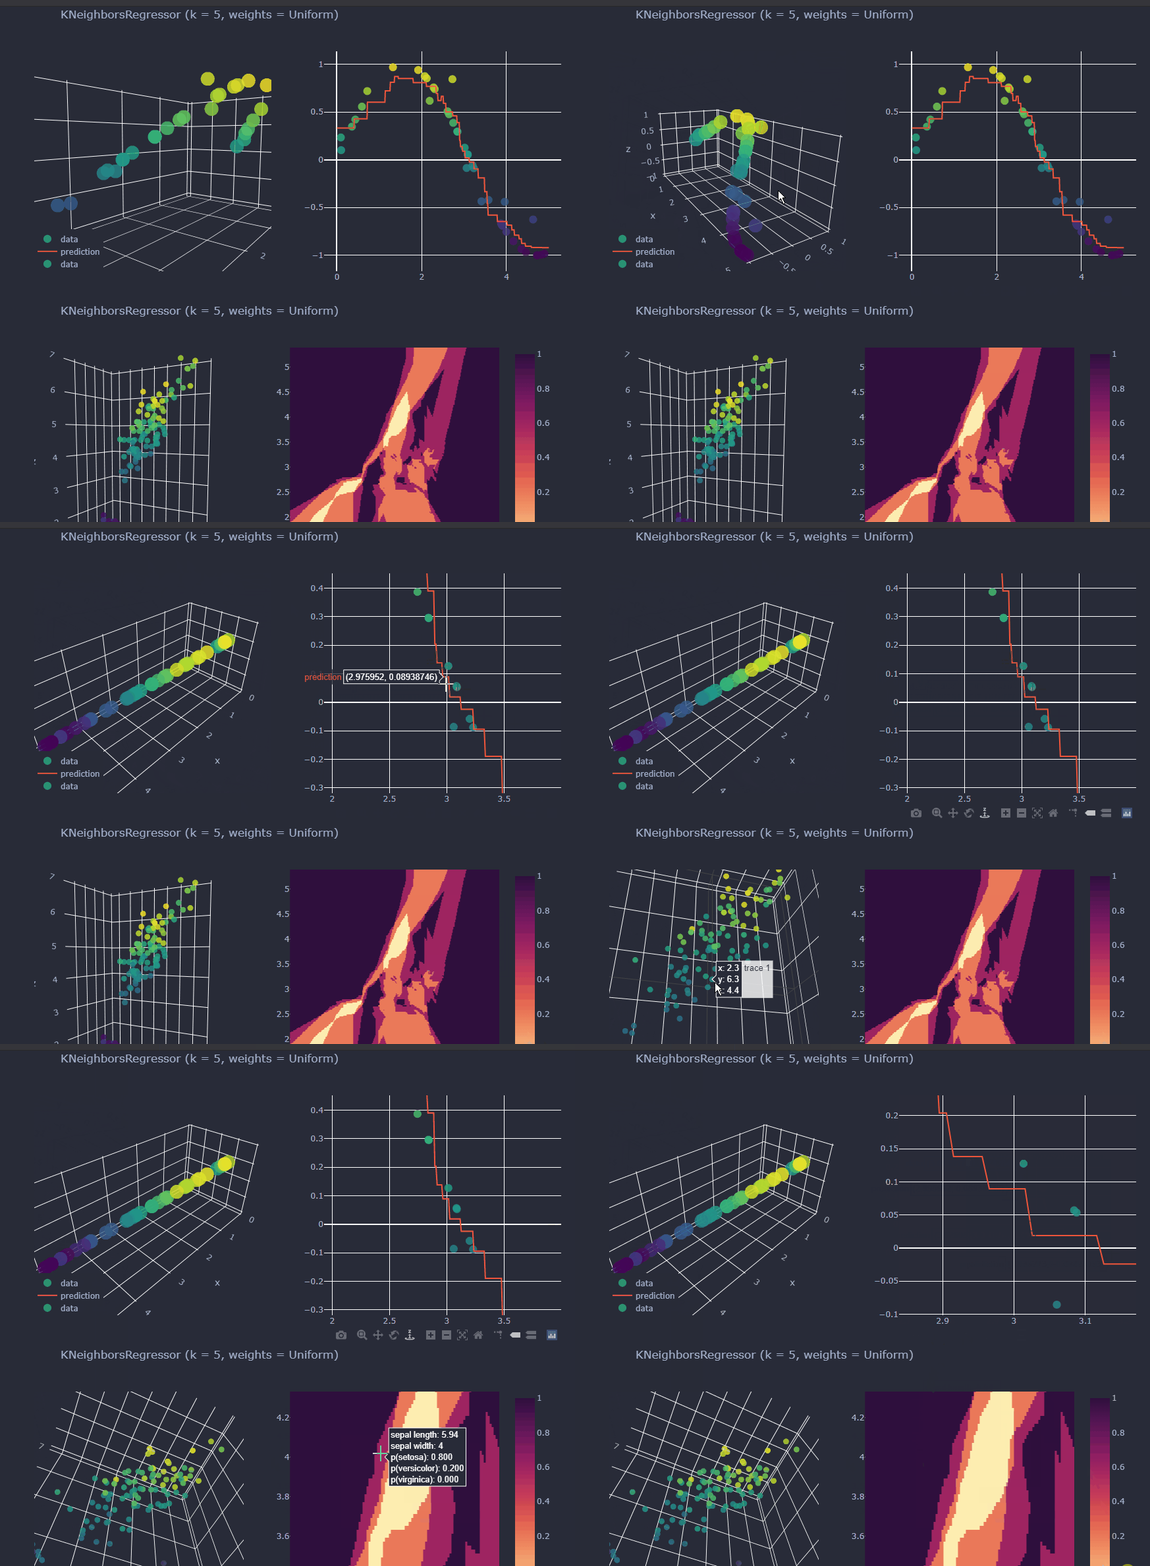
With the Interactive data visualization used which is used in Visualiser enables users to directly manipulate and explore graphical representations of data. Data visualization uses visual aids to help analysts efficiently and effectively understand the significance of data. Interactive data visualization software improves upon this concept by incorporating interaction tools that facilitate the modification of the parameters of a data visualization, enabling the user to see more detail, create new insights, generate compelling questions, and capture the full value of the data.
The main intension of the Project is to make the Algorithms interactive and tell the importance of Parameters tuning while developing a Machine learning Model.
by Jay